Main menu


You are here
April 2010
comparison of compression methods for database dumps
14 April 2010 - 7:11pm — drewI like to have automated daily database backups set up on my servers - for those hosting relatively small sites, the database dumps can usually be compressed down small enough to be sent as an e-mail attachment by the cron script which does the database dump. This is a really simple and cost-effective way of having offsite backups which provide daily snapshots of sites which are easy to access if anything goes wrong.
Initially I just used gzip to compress the sql files down, but as dump files inevitably grew, I decided to look into some alternatives, and in this post I'll share the results of my research. As I'm often sending these backups as e-mail attachments, the size of the compressed file is the main thing I care about, but this isn't the only factor in a comparison. Some of the methods of compression use more resources than others in terms of CPU and memory. I'm not too concerned about this as my dumps are only being done by cron once a day, but I've included a measurement of resource use; the time taken in seconds (as measured by the time command).
The compression methods I tried out included gzip and bzip2 (which should be available on most *nix servers), rzip (written by Andrew Tridgell of samba and rsync fame) and finally 7zip. In all cases, fast meant using the -1 switch, and best meant using -9 (n.b. rzip also has a -0 setting, but this didn't yield useful results).
For my tests, I used 3 different SQL files (uncompressed they are 16mb, 48mb and 83mb approx) - they are mostly made up of dumps of drupal sites, although there are a few other databases in there (each one is a mysqldump of all databases on a mysql 5 server). Here are the results:
Compression comparison - sizes in mb
16mb
48mb
83mb
gzip (fast)
2.19
8.27
19.94
gzip (best)
1.62
6.65
17.36
bzip2 (fast)
1.72
6.36
16.93
bzip2 (best)
1.17
5.14
13.07
rzip (fast)
0.95
5.01
12.00
rzip (best)
0.89
4.65
10.39
7zip
0.82
4.34
9.09
Compression comparison - time in seconds
16mb
48mb
83mb
gzip (fast)
0.309
1.020
2.072
gzip (best)
1.356
4.873
7.343
bzip2 (fast)
5.141
14.918
25.858
bzip2 (best)
7.732
22.026
44.834
rzip (fast)
2.400
5.931
11.582
rzip (best)
2.476
34.277
52.385
7zip
4.284
15.097
25.325
As I'm mainly interested in small compressed files, and don't care about performance or resource usage so much, my conclusion is that 7zip is the best fit for my needs. It's the best of the bunch in terms of producing small files, but still outperforms many of the others in terms of how fast it compresses the SQL files.
7zip also has other advantages; the cross platform port p7zip works great on most linux distros (and Mac OSX, I believe), and the original 7zip application is a windows app - so I can have my backup scripts send copies of database dumps to website owners and be confident they can access the dumps if the need ever arises. (p)7zip can also be pipe-lined (that is, it can take input from standard in and send its output to standard out), so it's pretty flexible in how it can be used in scripts.
A few reflections on the other methods / apps I tested; if performance is more important to you than it is to me, then rzip (at less than best compression ratio) may be worth a look - on its fast setting it did pretty well at making smaller files than gzip or bzip2 could and was not much slower than gzip (and faster than bzip2). Where 7zip does well with cross-platform availability and pipe-lining, however, rzip's not so good.
I should point out that my conclusions here are based on my own criteria (I want small compressed files, and don't care so much what it takes to get them). If your priorities are different, my conclusion may not work for you. In particular my use of wall time to measure the performance of these compression methods is very woolly. For example, I made no measurement of memory consumption, and this could be a significant differentiator if it's a factor that matters to you.
P.S. this post uses a new drupal module I put together which allows you to easily generate google charts from HTML tables. I plan to document this (and possibly release the module) soon. It's based on work by Martin Hawksey which was based on work by Chris Heilmann.
- Log in to post comments
Calcutta Rescue
14 April 2010 - 7:08pm — drew
I built Calcutta Rescue a new website on Drupal 6 during a period of volunteering I did in Asia.
The design for the site was done by the excellent Simon White of whitewebs.
Peoples Empowerment Foundation
14 April 2010 - 6:54pm — drew
I built Peoples Empowerment Foundation a new website on Drupal 6 during a period of volunteering I did in Asia.
The design for the site was done by the excellent Simon White of whitewebs.
The site uses Drupal's built-in multi-lingual functionality, along with i18n and related modules, to support content (and administration) in both English and Thai.
simple drupal module to generate charts from html tables using google chart api
27 April 2010 - 9:26am — drew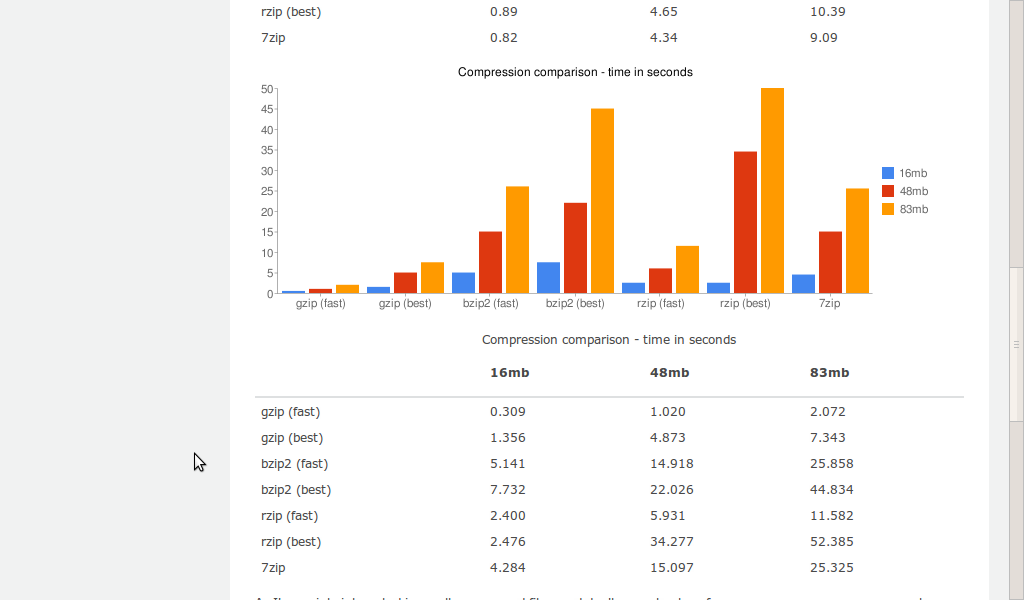
For my recent post comparing compression methods for database dumps I had some very simple data, and wanted to present some very simple charts. None of the many charting modules for drupal seemed to be simple enough for me, so I borrowed some code I found on the web and made my own drupal module.
There are lots of charting solutions for Drupal - several of them described and compared in two very comprehensive posts linked to from the Comparison of Charting Modules page on drupal.org. However, most of these modules seem to cater for situations where data is coming from the Views module and / or stored in CCK fields. My requirements were simpler still; I had two very small tables of data which I wanted to chart, and when I say tables I mean little HTML tables, not tables in the database.
My web searches soon threw up a couple of ways to do this using javascript on the client side. The most interesting of which included auto-table-to-chart which uses open flash charts, more than one blog post giving examples of HTML tables to Open Flash Chart using jQuery, and variations on a fairly old (2008) post by Chris Heilmann titled Generating charts from accessible data tables and vice versa using the Google Charts API.
I decided to settle on the simple, lightweight approach of using javascript to examine the HTML table, and generate the request URL to generate a chart using google chart api. 90% of the work had been done for me by Martin Hawksey in a post he made building on Chris Heilmann's original. The javascript in the example given there dealt with more than one column of data, and added line graphs to the original's support for pie charts.
I wanted vertical bar graphs, and to build the javascript into the drupal framework. This was pretty easy. First I made some simple (and pretty crude) changes to the JS. I made it a little more jquery-friendly using document.ready:
< (table2graph = function(){
> $(document).ready(function(){
... then I made a couple of tiny changes to the JS to accommodate vertical bar graphs (bvg); to this section:
if (cht=='lc'){
charturl += '|1:|'+yMarks.join('|')+'&chxp=1,'+yMarks.join(',');
charturl += addDataPoints(tData,'o',dpt);
charturl += '&chco='+niceCol.slice(0,tData[0].length).join(',');
charturl += '&chg=0,16.666667';
}
var chart = document.createElement('img');
... I added the following (using a line of code which was already there to give my bar graphs nice colours like the line charts which were already supported):
if (cht=='lc'){
charturl += '|1:|'+yMarks.join('|')+'&chxp=1,'+yMarks.join(',');
charturl += addDataPoints(tData,'o',dpt);
charturl += '&chco='+niceCol.slice(0,tData[0].length).join(',');
charturl += '&chg=0,16.666667';
}
if (cht=='bvg'){
charturl += '&chco='+niceCol.slice(0,tData[0].length).join(',');
}
var chart = document.createElement('img');
I also needed to add my bvg charts to an if statement which was dealing with the axis for line charts differently than for pie graphs, like so:
< if (cType=="lc"){ stringOut += tArray[0].join('|').replace(/ /gi, '+');}
> if (cType=="lc" || cType=="bvg"){ stringOut += tArray[0].join('|').replace(/ /gi, '+');}
else{
Now all that remained was getting my revised JS code into my drupal site. One easy way would be using drupal_add_js from within the theme. However I decided, as this is (arguably) more about functionality than themeing, to create a very simple drupal module to add the JS. I called the module chartfromhtml and pretty much all it does is this:
/**
* Implementation of hook_init().
*/
function chartfromhtml_init() {
drupal_add_js(drupal_get_path('module', 'chartfromhtml') . '/chartfromhtml.js', 'module', 'footer');
}
With this module enabled, I could use the google chart functionality from anywhere in my drupal site the same way as in the demos this is all based on. So to get charts generated from my small HTML tables, I simply added the following self-explanatory classes to the markup:
<table class="tochart typebvg size700x250">
If you think you might find this useful, you're welcome to download the chartfromhtml module (as a simple tarball for the moment). I believe Chris Heilmann's original code was creative commons, and I don't see why this couldn't become a proper GPL'ed drupal module if there's any demand for it.
My list of to do's would include rewriting the JS to be more jquery-esque, and adding support for more of the many chart types that google's API supports. I suppose there's no reason why open flash charts couldn't be an option as well.
- Log in to post comments