Main menu


You are here
debugging drupal with firephp
29 June 2010 - 11:11pm — drew
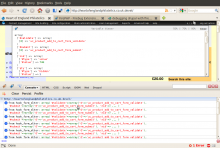
This week I found myself trying to debug some code used in an autocomplete CCK widget on a Drupal site. Because this is code is AJAX and doesn't follow the normal pattern of a full themed drupal page load, many of the unglamorous but useful debugging techniques such as dumping arrays and objects as drupal messages or JS alerts are no help; the only message or alert I was seeing a lot of was a 500 error dialogue.
Luckily the devel module can work with the FirePHP library and firefox extension to allow developers to do simple debugging using the firebug console, and it works with AJAXy callbacks like autocomplete widgets. Here's how to set it up.
There are two main ways to get the FirePHP library into your drupal site. This snippet of code from the devel module illustrates the two methods it uses to try and find the relevant files:
// See http://www.firephp.org/.
// Support Libraries API - http://drupal.org/project/libraries
if (module_exists('libraries')) {
$path = libraries_get_path('FirePHPCore') . '/lib/FirePHPCore/';
}
else {
$path = './'. drupal_get_path('module', 'devel') .'/FirePHPCore/lib/FirePHPCore/';
}
if (file_exists($path .'fb.php')) {
include_once $path .'fb.php';
include_once $path .'FirePHP.class.php';
}
...so if the libraries module is installed and enabled, devel will ask it to look for the code, otherwise it looks inside its own directory.
Keeping 3rd party libraries separate from drupal modules - which you'll want to upgrade at some stage - seems sensible to me, so I opted for the first option; I installed libraries module, and extracted the FirePHP library to sites/all/libraries, ending up with:
sites/all/libraries/FirePHPCore/lib/FirePHPCore/fb.php
Naturally I already had firebug installed, but I also needed to grab the FirePHP addon for it.
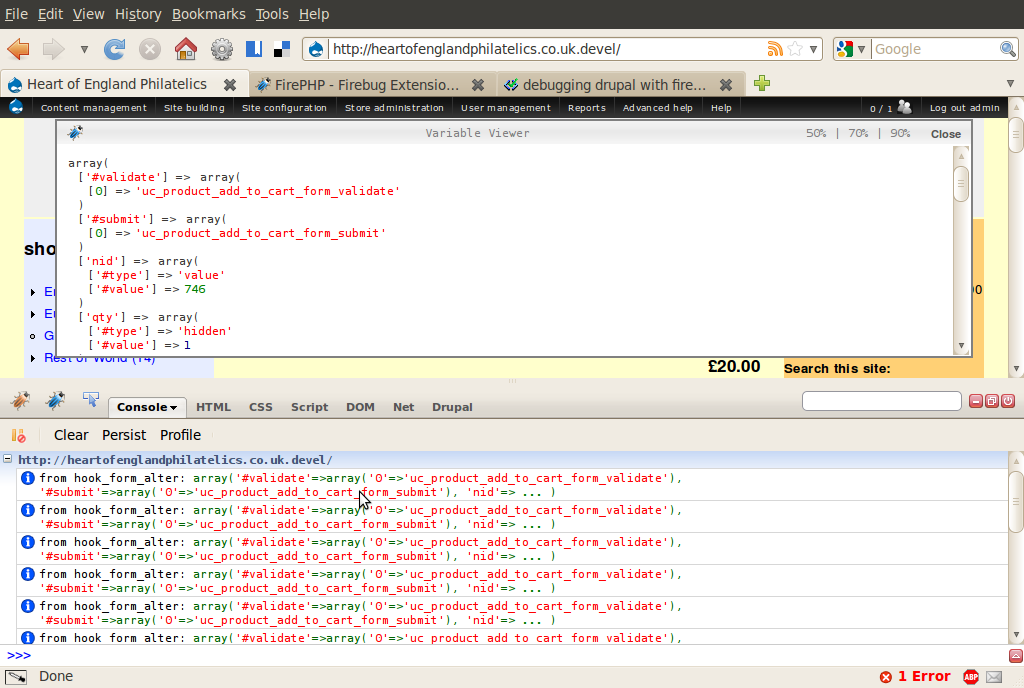
Now to actually start debugging - the simplest way to get something into the firebug console is by using a devel module function which simply wraps the FirePHP fb function:
dfb($var);
If it helps, you can also add labels and / or levels of severity easily, for example:
dfb($foo, 'probably bad', FirePHP::WARN);
dfb($bar, 'definitely bad', FirePHP::ERROR);
It took me a little while to work out why I wasn't seeing my debugging messages in the console at first - it turns out that I needed to enable the Net tab as well as the Console in firebug before it started working - it does tell you this on the FirePHP site but it took me a few minutes to spot it.
Another potential gotcha is that the devel module exposes a few permissions, and a user without these won't see the debugging info.
With my debugging messages showing up in the firebug console, I was able to fix my autocomplete widget in no time.
Finally I should mention a really good write up of this and several other drupal debugging techniques by Morten Wulff, and the fact that I'm using the release candidates of both the FirePHP library and the firefox addon and everything seems to be working well.
Happy debugging!
- Log in to post comments
Comments
Two small updates
Pages