Main menu


You are here
simple drupal module to generate charts from html tables using google chart api
27 April 2010 - 9:26am — drew
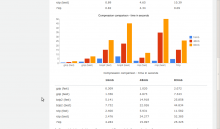

For my recent post comparing compression methods for database dumps I had some very simple data, and wanted to present some very simple charts. None of the many charting modules for drupal seemed to be simple enough for me, so I borrowed some code I found on the web and made my own drupal module.
There are lots of charting solutions for Drupal - several of them described and compared in two very comprehensive posts linked to from the Comparison of Charting Modules page on drupal.org. However, most of these modules seem to cater for situations where data is coming from the Views module and / or stored in CCK fields. My requirements were simpler still; I had two very small tables of data which I wanted to chart, and when I say tables I mean little HTML tables, not tables in the database.
My web searches soon threw up a couple of ways to do this using javascript on the client side. The most interesting of which included auto-table-to-chart which uses open flash charts, more than one blog post giving examples of HTML tables to Open Flash Chart using jQuery, and variations on a fairly old (2008) post by Chris Heilmann titled Generating charts from accessible data tables and vice versa using the Google Charts API.
I decided to settle on the simple, lightweight approach of using javascript to examine the HTML table, and generate the request URL to generate a chart using google chart api. 90% of the work had been done for me by Martin Hawksey in a post he made building on Chris Heilmann's original. The javascript in the example given there dealt with more than one column of data, and added line graphs to the original's support for pie charts.
I wanted vertical bar graphs, and to build the javascript into the drupal framework. This was pretty easy. First I made some simple (and pretty crude) changes to the JS. I made it a little more jquery-friendly using document.ready:
< (table2graph = function(){
> $(document).ready(function(){
... then I made a couple of tiny changes to the JS to accommodate vertical bar graphs (bvg); to this section:
if (cht=='lc'){
charturl += '|1:|'+yMarks.join('|')+'&chxp=1,'+yMarks.join(',');
charturl += addDataPoints(tData,'o',dpt);
charturl += '&chco='+niceCol.slice(0,tData[0].length).join(',');
charturl += '&chg=0,16.666667';
}
var chart = document.createElement('img');
... I added the following (using a line of code which was already there to give my bar graphs nice colours like the line charts which were already supported):
if (cht=='lc'){
charturl += '|1:|'+yMarks.join('|')+'&chxp=1,'+yMarks.join(',');
charturl += addDataPoints(tData,'o',dpt);
charturl += '&chco='+niceCol.slice(0,tData[0].length).join(',');
charturl += '&chg=0,16.666667';
}
if (cht=='bvg'){
charturl += '&chco='+niceCol.slice(0,tData[0].length).join(',');
}
var chart = document.createElement('img');
I also needed to add my bvg charts to an if statement which was dealing with the axis for line charts differently than for pie graphs, like so:
< if (cType=="lc"){ stringOut += tArray[0].join('|').replace(/ /gi, '+');}
> if (cType=="lc" || cType=="bvg"){ stringOut += tArray[0].join('|').replace(/ /gi, '+');}
else{
Now all that remained was getting my revised JS code into my drupal site. One easy way would be using drupal_add_js from within the theme. However I decided, as this is (arguably) more about functionality than themeing, to create a very simple drupal module to add the JS. I called the module chartfromhtml and pretty much all it does is this:
/**
* Implementation of hook_init().
*/
function chartfromhtml_init() {
drupal_add_js(drupal_get_path('module', 'chartfromhtml') . '/chartfromhtml.js', 'module', 'footer');
}
With this module enabled, I could use the google chart functionality from anywhere in my drupal site the same way as in the demos this is all based on. So to get charts generated from my small HTML tables, I simply added the following self-explanatory classes to the markup:
<table class="tochart typebvg size700x250">
If you think you might find this useful, you're welcome to download the chartfromhtml module (as a simple tarball for the moment). I believe Chris Heilmann's original code was creative commons, and I don't see why this couldn't become a proper GPL'ed drupal module if there's any demand for it.
My list of to do's would include rewriting the JS to be more jquery-esque, and adding support for more of the many chart types that google's API supports. I suppose there's no reason why open flash charts couldn't be an option as well.
- Log in to post comments
Comments
how to include the table.
Hello there,
Am really new to Drupal and wish to understand how to call this html table since when I tried to add this to the page.node.tpl file it does not seem to work.
Please help me
Thanks a lot
Srinidhi K
need more info
Sorry - I'm not sure I understand the question; have you downloaded, installed and enabled the module?
I'm not sure what you're trying to put in page.node.tpl?
With the module enabled, all you need to do is add classes to your HTML table tag as in the example given in the main post - e.g. "tochart typebvg size700x250".
Let me know if you need any more specific help.
Pages